
Most Popular


![[Herald Interview] Mom’s Touch seeks to replicate success in Japan](http://res.heraldm.com/phpwas/restmb_idxmake.php?idx=644&simg=/content/image/2024/04/29/20240429050568_0.jpg&u=)

-
6
Police to open alleged stalking probe over pastor over Dior bag scandal

-
7
'Queen of Tears' finale sets record viewership ratings as tvN's most-watched series ending

-
8
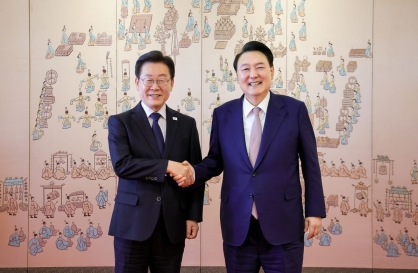
[News Focus] Lee tells Yoon that he has governed without political dialogue
![[News Focus] Lee tells Yoon that he has governed without political dialogue](//res.heraldm.com/phpwas/restmb_idxmake.php?idx=644&simg=/content/image/2024/04/29/20240429050696_0.jpg&u=20240429210658)
-
9
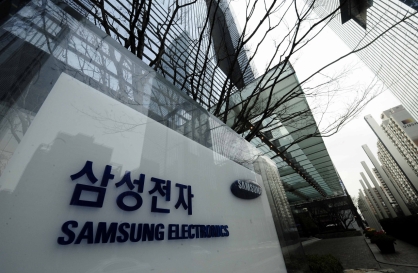
Samsung chip business back on track, logs W1.9tr operating profit in Q1
-
10
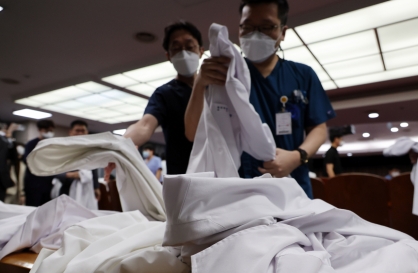
Seoul to deploy more military doctors to fill med prof void


![[News Focus] Lee tells Yoon that he has governed without political dialogue](http://res.heraldm.com/phpwas/restmb_idxmake.php?idx=644&simg=/content/image/2024/04/29/20240429050696_0.jpg&u=20240429210658)


[R&D POLICY IN KOREA(37)] Korea’s agricultural productivity and R&D investment lag behind major OECD countries
ByPublished : Nov. 4, 2010 - 18:25
It is widely known that as the Korean economy grew based on exporting and manufacturing, the position of the agriculture industry in the national economy and its contribution to growth fell dramatically.

Compared to agriculture, manufacturing may indeed be the more rational and efficient method to utilize Korea’s natural conditions, such as its climate and land area. Yet, in some advanced countries, such as the Netherlands, which has an unfavorable climate and relatively small land area, their agricultural industry has been evaluated highly on a global level.
In this regard, this paper will examine the agricultural performance and competitiveness of major countries through trade balance, labor and land productivity, and study the differences in capital investments and R&D expenses among countries that result in a gap in agricultural performance and competitiveness.
The subjects of the analysis were 10 OECD countries for which there is comparable data, including the Republic of Korea. The 10 countries were Denmark, Germany, Greece, Hungary, Japan, Poland, Portugal, Spain, the Netherlands and Korea. The data used for the study included OECD STAN, OECD BTD, OECD ANBERD, OECD IO Table, EU-KLEMS, and the U.N. System of National Accounts (SNA).
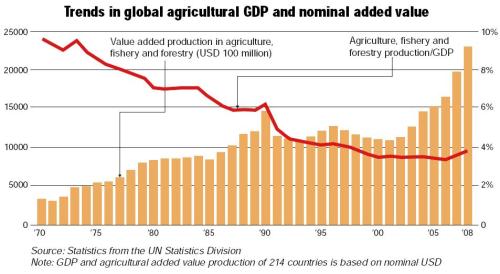
Before conducting a comparison of the agricultural R&D productivity among countries, we examined the agricultural production of each country. As of 2008, the global agricultural added value reached $2.3 trillion, an increase of 730 percent from $316.8 billion in 1970. However, with the rapid industrialization of developing countries and the progressing industrial structures of advanced countries (expansion of the services industry), the proportion of agriculture in global GDP has fallen significantly from 9.7 percent in 1970 to 3.8 percent in 2008.

In 2008, China accounted for 21 percent, the highest proportion of the global production in agriculture, fishery and forestry products, followed by India, the U.S., Brazil, Japan, Russia, Indonesia, Nigeria and Turkey. Korea ranked 19th, representing only 1.1 percent of global production. In the case of the Netherlands, its proportion of the global production reached only 0.6 percent in 2008, scoring even lower than Korea.
A study of the position of agriculture in major OECD countries shows that the rate of global agriculture added value of global GDP fell from 9.7 percent in 1970 to 3.8 percent in 2008. The continuous decline in the proportion of this industry is due to the sophistication of industrial structures (expansion of the services industry), among others.
The proportion of agriculture in the Korean economy is decreasing steadily: 6.2 percent (1995), 4.6 percent (2000) and 2.5 percent (2008). However, it is still higher than advanced agricultural countries, especially the Netherlands (1.8 percent) and Denmark (1.2 percent), and manufacturing-oriented countries such as Germany (0.9 percent) and Japan (1.4 percent).
The proportion of workers in the agricultural industry is also higher in Korea than that of Denmark, the Netherlands and other advanced agricultural countries. The proportion of employed workers in agriculture out of the total number of workers in Korea is around 7 percent, whereas in Japan it is about 5 percent, the Netherlands 3 percent and Denmark 3 percent.
Agricultural production, the share of agriculture in GDP, and the number of agricultural workers out of the total working population of the Netherlands, are smaller than that of Korea. This may mean that an “economies of scale” will not hinder Korea’s development into a strong agricultural country. Furthermore, it can be interpreted that there is great potential for Korea’s agricultural industry to develop in terms of improvements in quality and efficiency.
Agriculture trade balance
By comparing the export volume of 46 countries on OECD BTD in 2008, the U.S., with its great expanse of land and mild climate, recorded the highest with $67 billion. Brazil came in third place ($22 billion) and Canada in fourth place ($21.6 billion), meaning that countries with large territories had greater export volumes. However, the Netherlands came in second place with exports in agriculture of $24.8 billion despite its relatively smaller land area. In contrast, China (21 percent of global production) and India (9.6 percent of global production), which came in 1st place and 2nd place, respectively, in their shares of the global production of agriculture, fishery and forestry came in 10th place and 9th place in terms of exports. The reason may be because their large populations consume a considerable part of their production, leaving a relatively small portion to be exported.
As for agricultural imports, China had the greatest import volume, recording $41.7 billion in 2008, followed by the U.S. ($33.9 billion), Germany ($32.1 billion), Japan ($27 billion) and the Netherlands ($19 billion). Korea came in 13th with $9.8 billion in agriculture and fishery imports based on OECD BTD.

In terms of the size of the trade balance in agriculture, fishery and forestry products by country based on the difference between imports and exports as mentioned above, the U.S. benefited the most with $33.1 billion in surplus from the global trade in this industry. Next was Brazil ($17.7 billion), followed by Canada ($12.6 billion), Argentina ($12 billion), and Australia ($8.1 billion), showing that countries with large territories were on the top of the list. In addition, Thailand was seventh ($5.6 billion), Indonesia was ninth ($4 billion) and India ranked tenth ($2.7 billion). Furthermore, among OECD countries, the Netherlands (sixth place with $5.8 billion) and France (eighth place with $5.1 billion) recorded relatively high trade surpluses. Out of the 42 countries on OECD BTD, 18 countries recorded surpluses, whereas 24 countries recorded deficits. As of 2008, Korea recorded a deficit of $9.1 billion, coming in 38th in terms of the trade balance of the countries in the analysis.
Agricultural productivity
This study conducted a more in-depth comparison of agricultural productivity among the major countries. High productivity signifies that the output is greater than labor input, and this is due to the higher input of other production factors in addition to labor, such as capital, and land and R&D investment. These production factors are combined with labor to result in higher output.
Labor productivity is calculated by dividing output or added value by labor input. Labor input includes all variables with different measures related to labor quantity, such as the number of workers, working hours and cost of employment (e.g. wages). This study used the output per worker as its measure of labor productivity.
Based on nominal prices, labor productivity in agriculture was $53,939 in Denmark as of 2005, the highest among the countries studied, followed by the Netherlands with $47,622, Germany ($35,314) and Spain ($27,253). The output per capita in agriculture was $13,937 in Korea, coming in eighth, followed by Poland ($4,852) and Portugal ($7,994).
Based on the purchasing power parity (PPP) rates, which take into account the cost of living in each country, the Netherlands had the highest productivity among the 10 countries, with $41,554 as of 2005. On the other hand, Denmark, which recorded the highest productivity based on nominal terms, was the third highest with $36,415 after Hungary ($36,587). Meanwhile, Korea recorded only 45 percent of the Netherlands’ amount and placed seventh in terms of labor productivity of $18,783.
R&D investment and the productivity gap
High per capita productivity and efficient use of land signify either a high per capita capital ratio or a higher proportion of R&D expenses, showing that a country had high technical competitiveness. From an overall perspective, capital investments can become important factors that enhance productivity, and R&D expenses can also improve technical competitiveness.

In terms of the agriculture investment ratio, the increased rate of the annual average real added value during the period of 19952005 in major countries showed that Poland had the highest investment increase rate at 5.6 percent, followed by Greece (5.4 percent), Spain (3.3 percent) and Denmark (2.1 percent). On the other hand, Hungary (a 1.5 percent decrease during 20002005), Portugal (a 1.4 percent decrease during 20002005) and Germany (0.5 percent decrease during 19952005) showed that real fixed capital investments were falling.
As seen in Fig. 4, the Netherlands, with the highest per capita productivity, recorded only a 1.6 percent increase in the annual average real fixed capital investment rate. Therefore, the relation between agricultural labor productivity and the increase rate of real fixed capital investment is not clear.

In terms of R&D expenses, out of 10 major countries, the country that had the highest share of R&D investment in nominal added value from 19952005 was the Netherlands (0.8 percent annual average), showing a significant gap with other countries. Its R&D investment/added value ratio even reached 1.24 percent in 1998. The next highest countries were Japan, Denmark and Hungary, each with around 0.2 percent. Those with lower shares were Portugal (0.02 percent) and Greece (0.04 percent), followed by Korea at 0.09 percent. The correlation coefficient, which illustrates the correlation between labor productivity and the ratio of R&D expenses to added value, was high at 0.67 based on the nominal exchange rate and 0.71 based on the PPP, meaning that the two variables were positively correlated.
Implications of agricultural R&D
1. The agricultural industry in Korea does not have a low position in or a low proportion of the national economy. It is an industry worth nurturing and it has potential.
The declining proportion of agriculture in global production is a common trend, and not unique to Korea. It is caused by the industrialization of developing countries and the expansion of the services industry of advanced countries. The global agricultural added value ratio against global GDP fell from 9.7 percent in 1970 to 3.8 percent in 2008. Comparing 1995 and 2005 shows that the proportion of the agricultural industry is on a declining trend in all OECD countries, examples being Germany (1.3 percent→0.9 percent), Japan (1.9 percent→1.4 percent), the Netherlands (3.5 percent→1.8 percent) and Denmark (3.5 percent→1.2 percent).
Although the agricultural added value has also continued to fall in Korea, from 6.2 percent (1995) to 4.6 percent (2000) and 2.5 percent (2008), it is higher than those of the Netherlands (1.8 percent), Denmark (1.2 percent) and Japan (1.4 percent). In addition, Korea’s share of the global agricultural production, its proportion of employed workers in this industry and the proportion of the local economy accounted for by agriculture are greater than those of the Netherlands and Denmark, which are well-known advanced agricultural countries. In conclusion, the proportion of agriculture in the economy and the input size are quite significant. Considering the economies of scale, the Korean agricultural industry will be worth nurturing and holds great potential.

2. Korean agricultural labor productivity is extremely low, reaching only half that of the Netherlands.
The agricultural per capita output in Korea based on the PPP is $18,783, ranking seventh among the ten countries under study, and reaching only 45 percent of the Netherlands. Those with lower per capita outcomes than Korea are Poland, Portugal and Greece, countries that have smaller economies and are behind in industrial development. Based on the nominal exchange rate, the agricultural per capita output in Korea was $13,937, ranking eighth out of ten countries, followed by Poland ($4,852) and Portugal ($7,994), and reaching 30 percent of that of the Netherlands.
3. The reason for the low agricultural productivity in Korea is because of a lack of fixed capital investment and R&D investment.
The real fixed capital investment increase rate over the period of 19952000 was -4.5 percent in Korea, recording the lowest out of the 10 countries under examination. This, however, goes against countries that are increasing their fixed capital investments, primarily Poland (5.6 percent), Greece (5.4 percent), Spain (3.3 percent), Denmark (2.1 percent) and the Netherlands (1.6 percent), and it is directly impairing the competitiveness of this industry in Korea. The R&D investment in agriculture from 19952005 showed that Korea was eighth out of the ten countries. In terms of R&D investment to added value ratio, Korea was eighth (0.09 percent) followed by Portugal (0.02 percent) and Greece (0.04 percent). On the other hand, the Netherlands was dominant in this area (0.8 percent), followed by Denmark (0.25 percent), Japan (0.28 percent) and Germany (0.17 percent).
The correlation coefficient of agricultural R&D investment/added value ratio and labor productivity was extremely high, with 0.67 based on the nominal exchange rate and 0.71 based on the PPP exchange rate, implying that Korea’s low R&D investment in agriculture is the cause of its low labor productivity.
This is the 37th in a series of articles introducing the Korean government’s R&D policies. Researchers at the Science & Technology Policy Institute will explain Korea’s R&D initiatives aimed at addressing major socioeconomic problems facing the nation. ― Ed.
By Lee Joo-ryang


![[Today’s K-pop] Seventeen sets sales record with best-of album](http://res.heraldm.com/phpwas/restmb_idxmake.php?idx=642&simg=/content/image/2024/04/30/20240430050818_0.jpg&u=)