
Most Popular


-
6
US confirms $6.4 billion chip subsidy for Samsung
-
7
Israel says Iran launched more than 300 drones and missiles, 99% of which were intercepted

-
8
[KH Explains] How should Korea adjust its trade defenses against Chinese EVs?
![[KH Explains] How should Korea adjust its trade defenses against Chinese EVs?](//res.heraldm.com/phpwas/restmb_idxmake.php?idx=644&simg=/content/image/2024/04/15/20240415050562_0.jpg&u=20240415144419)
-
9
BTS' Jungkook creates Instagram account for his dog

-
10
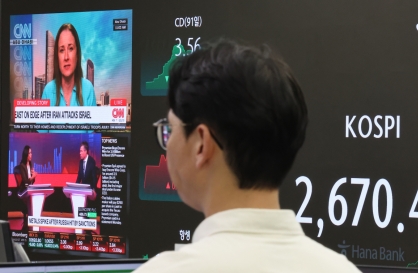
Korea braces for blows from Middle East conflict


![[KH Explains] How should Korea adjust its trade defenses against Chinese EVs?](http://res.heraldm.com/phpwas/restmb_idxmake.php?idx=644&simg=/content/image/2024/04/15/20240415050562_0.jpg&u=20240415144419)


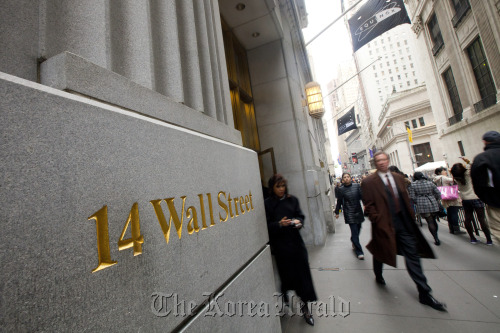
Stock movements may seem irrational, but they tend to follow patterns even in times of crisis
NEW YORK (AP) ― The threat of severe nuclear contamination from a breached Japanese nuclear reactor still looms. The outcome of the escalating war in Libya is uncertain. Yet The Standard & Poor’s 500 index ended the week up 2.7 percent. The Dow Jones industrial average rose 3.1 percent. So what happened to all that headline-driven volatility from two weeks ago?
If you look at historical patterns, this week’s rebound isn’t so surprising. The numbers suggest stocks will likely keep rising for the next few months.
Catastrophic events can move stock prices dramatically: At one point during the week after Japan’s devastating earthquake and tsunami, the Dow gave up all its gains for the year. Within six trading days it had returned to where it was before the disaster.
That may seem quick, but it’s not. Brian Gendreau, strategist for the Financial Network, an advisory firm, studied the effect on the Dow of six major disasters. In all but one case the index declined at first, but returned to its pre-disaster level in an average of fewer than four days. In the fifth case, last year’s oil spill in the Gulf of Mexico, it didn’t decline at all.
The Dow fell as much as 4.6 percent after each of the five other calamities Gendreau looked at: the 1979 nuclear accident at Pennsylvania’s Three Mile Island; the 1986 Chernobyl nuclear accident; the 6.9-magnitude earthquake that struck Kobe, Japan, in 1995; the 2004 Indian Ocean Tsunami; and Hurricane Katrina in 2005. The longest it took the Dow to recover was 15 days, after the Kobe earthquake. In the case of Chernobyl, the Dow recovered in a day. In that context, last week’s stock recovery took slightly longer than average.
There’s another clue that the rebound is for real, in spite of the recent dips and leaps in the market. It can be found in the 50-day moving average of the S&P 500, which measures the average value of the index over the most recent 50 days.
Comparing an index level to its moving average shows what general direction the market is taking, without the interference of short-term spikes and plunges. Analysts fretted when the S&P 500 fell below its 50-day moving average on March 10. On Thursday, it climbed back above the average.
But the moving average can also signal longer-term trends. Before March 10, the S&P 500 had stayed above its 50-day moving average for more than 100 days. That has only happened five other times since 1980, says Ryan Detrick, strategist for Schaeffer’s Investment Research.
After each of those blocks ended, the index rose by an average of 6 percent in the following three months. Four out of those five times, it rose an average of 3.3 percent after just a month.
Then there’s the macroeconomic view. Barry Knapp, chief economist for Barclay’s Capital, says stocks are probably safe from a steep drop for the next six months. He expects the economy to follow the patterns of the last three recessions.
In the last three economic downturns, the Federal Reserve started to unwind the interventions it had made to keep markets afloat well after the economic picture started to improve. Knapp calls the six-month periods leading up to each of those turning points in Fed policy a “sweet spot,” and says the economy is in one now.
The Fed raised interest rates in May 1983, six months after the economy began to recover from the 1981-1982 recession. The Fed waited nearly three years to raise rates after the recession that lasted from July 1990 to March 1991. And in January 2004, three years after an eight-month recession, the Fed reversed what Knapp calls its “unconventional policy” of pledging to keep interest rates low, although it didn’t raise rates until June.
Knapp expects the Fed to end its purchases of Treasurys, allow its balance sheet to shrink, and eventually raise interest rates between September and November.
In past sweet spots, the S&P 500 didn’t fall more than 7 percent. That’s less than the 10 percent drop market analysts call a “correction,” or a temporary downturn within a bull market.
“If you’re really getting into the middle of a business cycle, even if you’re getting shocks to growth, you shouldn’t be seeing a 10 percent correction,” says Knapp.
Even though the impact of major disasters on the market has typically been short-lived, it’s important to remember that Japan’s nuclear crisis isn’t resolved yet and the long-term economic effects of the disaster are uncertain.
In a worst-case scenario, a cloud of radioactive steam could reach Tokyo, crippling the world’s third-largest economy. For the quake and its nuclear aftermath to dent global growth, there would have to be “some sort of extended shutdown in the Japanese economy and a major shutdown in the supply chain” of weeks or months, says Jeffrey Cleveland, senior economist at money manager Peyton & Rygel. That possibility is small, and the market seems to have taken that into account, Cleveland said.
From a distance, the market can seem prone to unpredictable swings. Yet even as a long list of international threats rattle investors, stocks are still moving more or less by the numbers.
(AP)